Blog
Announcements, analysis and opinions on industry trends around the mobile programmatic world.

Subscribe now, and receive the latest programmatic content directly on your inbox!
Thank you for subscribing to our newsletter
Many advertisers base their advertising partners performance evaluation on the results they see. The problem comes when those results hide the real contribution of each one of them, as you can see in this example below.
We at mediasmart were granted access by one of our clients to all of its partner results in their MMP (Mobile Measurement Platform). We found this:

We had found that 2 of the partners the advertiser is working with (partner 1 and 8 – the orange ones in the table) are doing click flooding/spamming. How do we know this?
- Huge number of clicks, and no impressions being tracked.
- Really poor CR (Conversion Rate). If you compare the partner 1 CR with the total CR it does not look so bad, but the average CR is very low precisely due to those 2 partners. If we exclude those 2, the average CR goes up from a 0.27% average to 13.01%!
- We don’t have info about the partner 8 cost, but partner 1 shows the best CPI, in spite of the awful CR (too good to be true?)
- Assisted rate of partner 1 is quite low. They serve so many clicks that they have a lot more chances to get installs attributed to them. Part of their results are thanks to other partner actions and organic installs. Partner 8 has a high assisted rate, but we found out later that is because Partner 1 is “stealing” a lot of its conversions, as we will see below.
- No post view conversions (which makes sense as they are not tracking impressions). Clicks prevail over impressions and have longer attribution windows, so they have more chances to “look good” in the table comparison.
The logic of partners doing click fraud
Let’s have into account that when you serve an impression, you are at least exposing a user to a brand. When you just count a click, you have no proof whatsoever that the customer has been exposed to your brand… The more clicks (which seem to cost nothing) the more chances of “stealing” conversions.
If you think about attribution being just a math game, the incentive of click flooding for an advertising channel is to increase the chances of attributing a conversion to its campaigns by generating as many clicks as possible. That conversion would have happened anyway (because it is organic or generated by other channels) and the advertising channel just happens to count a click for that user before the user opens the app.
What does it mean to the advertiser? More and more budget is given to partners that “steal” conversions from both a) other partners - that money should have been given to the other partners - and b) organic conversions - that money should literally not be spent. Advertisers think these channels are a no-brainer, because they pay CPI, but they do not realize that they are paying for installs they would have gotten anyway. In other words, they are wasting their money.
The impact on the advertiser
The advertiser in this example wants to grow, get a higher volume of total installs. Can he achieve it with partners that are doing click flooding?
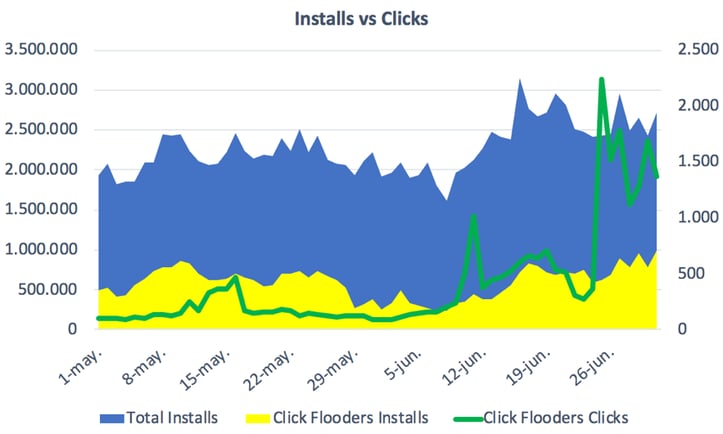
Let’s see this graph that compares the total number of installs with all the clicks generated by the 2 partners generating a huge number of clicks:

From the 8th of June onwards there is an increase in the total number of installs and we also see many more clicks from those 2 partners. There could be a correlation between those extra clicks and those extra installs, but to be sure let’s see more data.
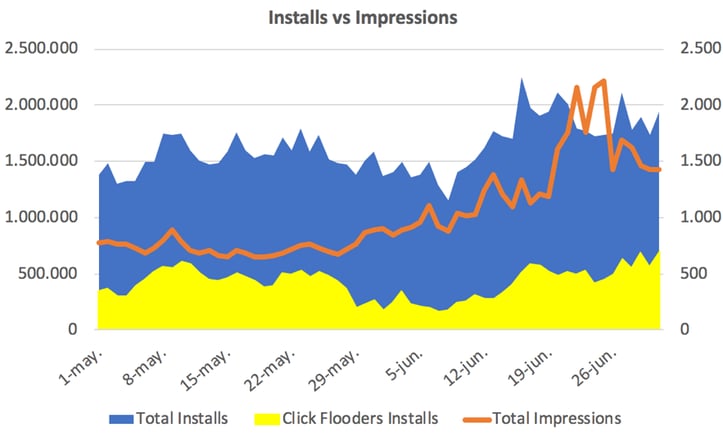
How does the evolution of total installs look like when compared to the number of impressions served?

On that same period (after the 8th of June), impressions served had also risen, which can also help to explain why total installs have increased. Actually, there seems to be a clearer correlation between total installs and impressions, rather than clicks from click flooders.
Assisted rate – a valuable indicator
Let’s have another look, now at the assisted rate provided by the MMP – the KPI that tells us what is the percentage of converted users that had been impacted by a certain channel but ended up attributed to another channel. The higher it is, the more users impacted by a channel are being attributed to another channel. For example: if the assisted rate of partner 5 is 81%, it means that from all of the users that installed the app and had previously seen/clicked on an ad placed by partner 5, 81% of those installs were attributed to another channel.
Click flooders are expected to have a low assisted rate. They “generate” so many clicks from so many users that they are more likely to get conversions from other channels. They don’t generate value to the advertiser, as they do not generate new conversions – if they stop their activity, other channels and the organic channel would have a lot more conversions.
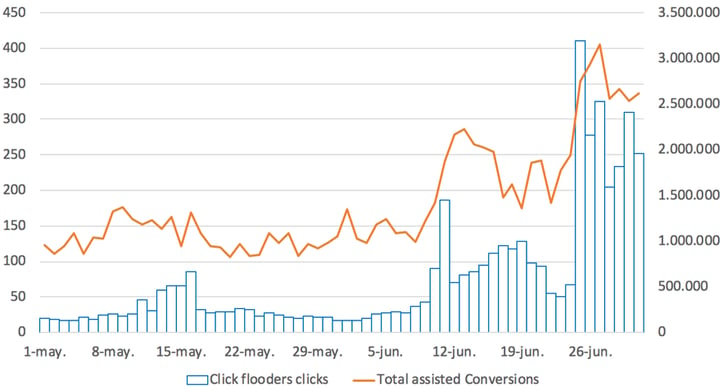
Indeed, the more clicks from click flooders, the higher the overall number of assisted conversions:

Now let’s see this same indicator from another angle: partner 1 has a low assisted rate of 16%. However partner 8, who is also doing click flooding, has an assisted rate of 61%. How is that possible? The explanation is related to the nature of their activity: in spite of the fact that partner 8 is getting conversions that should be attributed to other channels, partner 1 is more aggressive with click flooding than partner 8, and is “stealing” more conversions from partner 8 than partner 8 is “stealing” from partner 1.
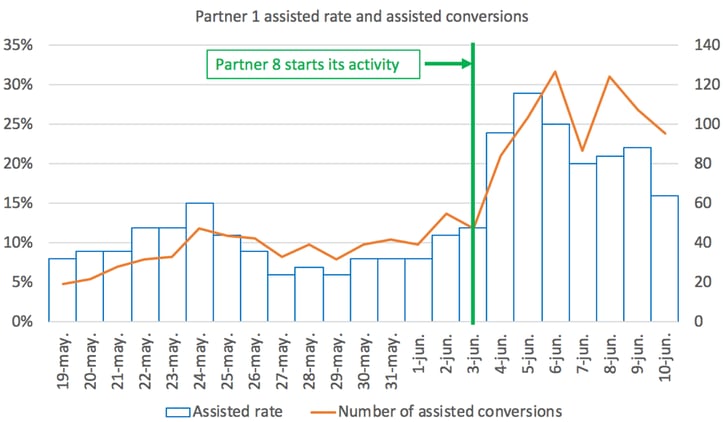
Have a look at the evolution of the assisted rate and number of assisted conversions of partner 1 per day, during the months of May and June:

When partner 8 started doing click fraud (“stealing” conversions from other channels), partner 1 was also affected, and lost some of those installs – this shows that the activity of both of these partners impacts all the other channels, including each other. It also tells us that partner 1 has a more aggressive click flooding strategy, as its assisted rate is lower than partner 8 (16% vs 61%).
So, how does an advertiser reach true growth?
In this real case scenario there is no doubt that the advertiser is wasting part of its budget by investing in partners doing click fraud. Other customers in the same situation have already taken a few measures (ordered from the less efficient to the most efficient):
- They force all providers to inform the MMP of impressions, in addition to clicks
- Some even include it in their contracts: they will NOT pay for any installs coming from publishers with less than a certain conversion rate (from click to install)
- They block click flooders via their antifraud tools.
- They use their own ad servers to have full control over their creatives: instead of sending the creatives, they send an HTML file hosted on their own server. This allows advertisers to know how many impressions and clicks are really being generated.
However, in order to maximize advertising investment efficiency, the ultimate goal of the advertiser is not only to avoid fraud but to understand what partners are generating added value. That’s where incremental metrics come into play: they allow you to not only see the number of conversions “attributed” to a campaign, but the number of those conversions that are incremental. In other words, incremental metrics do not take into account “results” that would have happened anyway independently of the campaign. You can see in more detail the importance of measuring incremental KPIs in this other article: eCPA is dead! Long live the incremental eCPA!
Topics: app promotion, incremental metrics
%20(1).jpg)


